One of the themes of our new book The Dynamics of Care is that the number of interconnections in a situation (dynamic complexity) is often more important than the details in a situation (detailed complexity). Health and social care is awash with interconnections (such as patient / service user pathways) and the multitude of information feedbacks which make the pathways work….many of which are hidden and insulated from one another by agency boundaries.
Over the course of 15 years of work in this maelstrom of interconnectivity, we have often asked people to try to describe some specific cause and effect linkages, for example, to suggest how the number of people receiving home care affects elective waiting times in hospital. At first glance these seem to be unrelated variables in different organisations and, many people often have difficulty making the connections. Statisticians would no doubt suggest the way to test the link would be to collect data and carry out correlation and regression analysis. We however would advocate that there is much more understanding and learning to be gained by explicitly tracing out the cause and effect linkages between such variables.
A stock/flow map can assist this process. The map below shows a simplified high-level view of unscheduled and elective pathways through hospital and into social care and includes the use of boarders by which unscheduled patients overspill into elective beds in times of high demand. The trail of linkages between social care capacity (top right) and elective operations (bottom left) is captured in red and the sequence of cause and effect is described below.
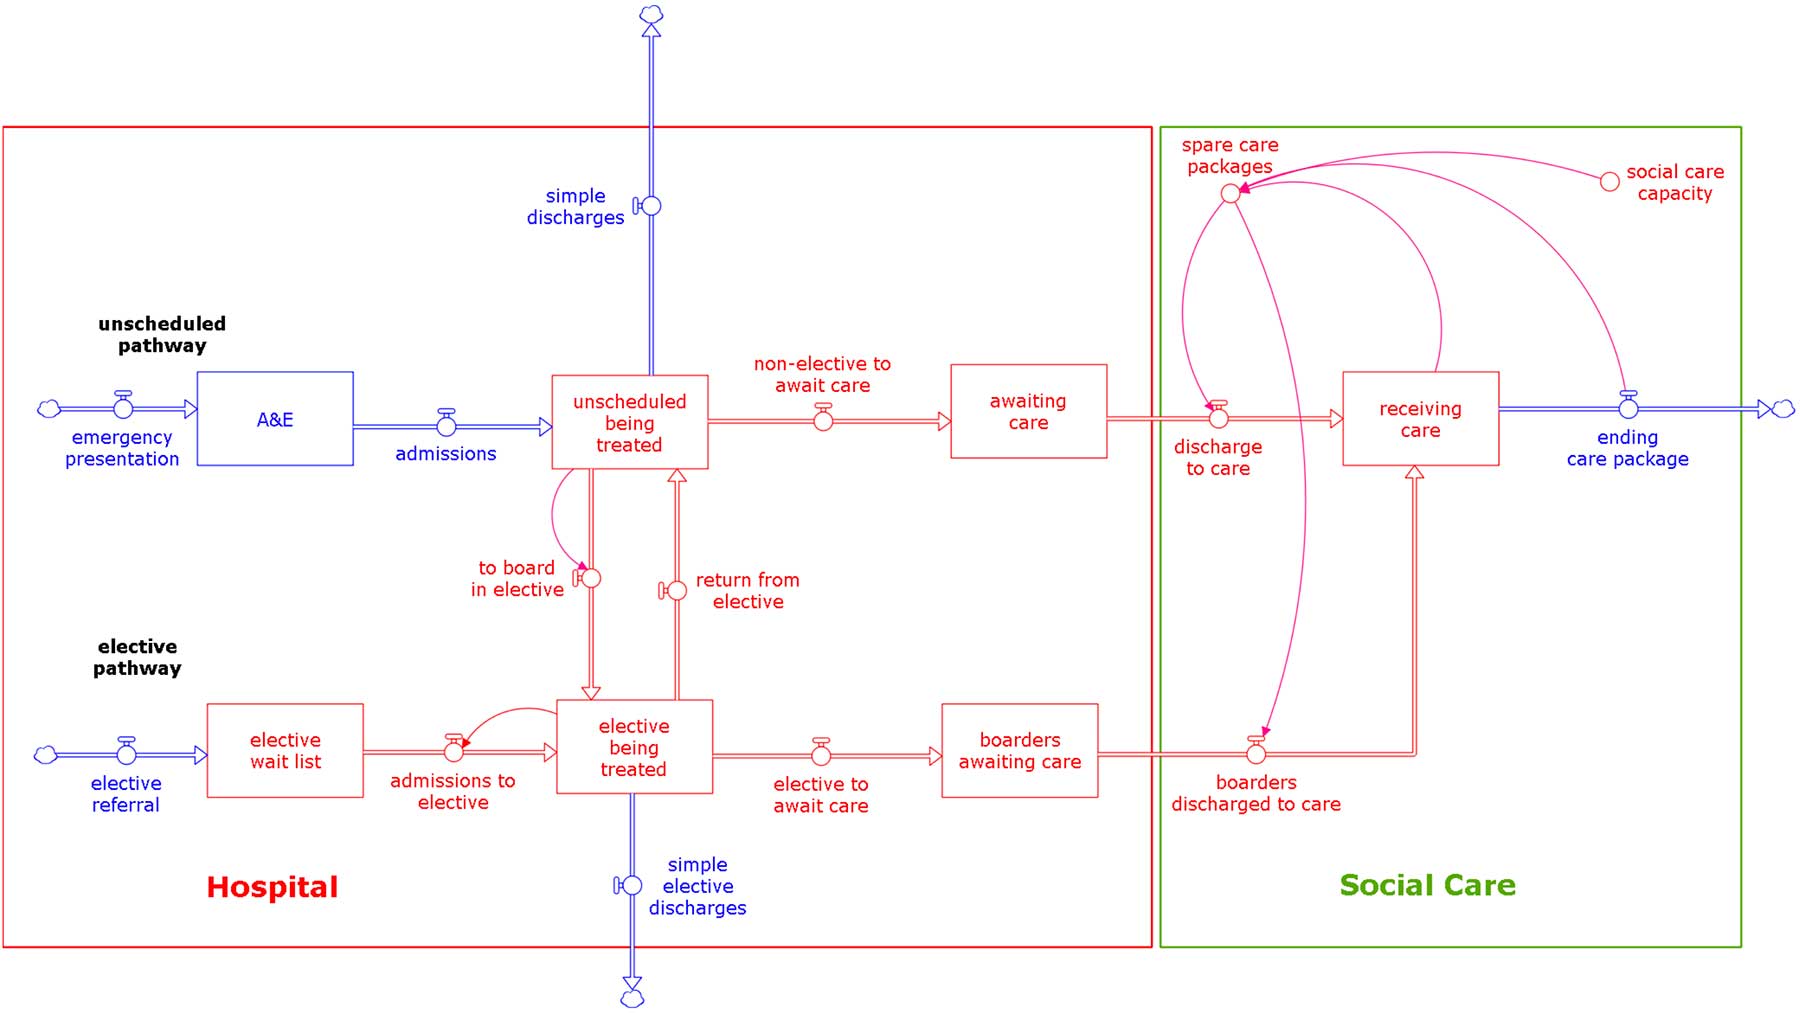
The number of people receiving social care depends on the social care capacity. If this can be increased then:
- the discharge (flow) of people from hospital to care can increase
- and the (stock) number of people awaiting care in hospital (delayed transfers) will reduce
- fewer or no unscheduled care beds will be occupied by boarders awaiting care
- fewer or even no boarders will move from unscheduled to elective beds
- if there are fewer unscheduled boarders occupying elective beds, most or all of the elective bed capacity can be used as it should be, and there will be more elective admissions,
- the elective wait list will be lower than it would have been
- reducing the elective wait time
The net effect is that increasing social care capacity reduces delayed transfers of care and reduces elective wait times (and increases elective procedures). Additionally, this sequence suggests that if the number receiving care can go up, all the other coping strategies which hospitals use in times of high demand in addition to outliers (such as, reducing treatment times, demand management, over-spilling unscheduled admissions to ambulances and spot purchase of social care) can also be eliminated together with their effects on staff productivity, morale and costs. Moreover, cost savings could (if care was truly integrated) be fed back into more social care capacity to reinforce the whole process.
Chapter 10 (Towards a Dynamic Theory of how Hospitals Cope in times of High Demand) of the book explores these coping strategies and their unintended consequences in detail and chapters 8 (Integrated Care) and 17 (Workforce Projects to assist Health and Social Care Integration) demonstrate changes in the role of social care staff that could make the connections described here work better.
To explore a simple model of delayed discharges try this.